Social media analytics: which metrics actually matter for automated content
- social media metrics
- social media analytics
- which metrics to track
- engagement metrics
- post performance
- template analytics
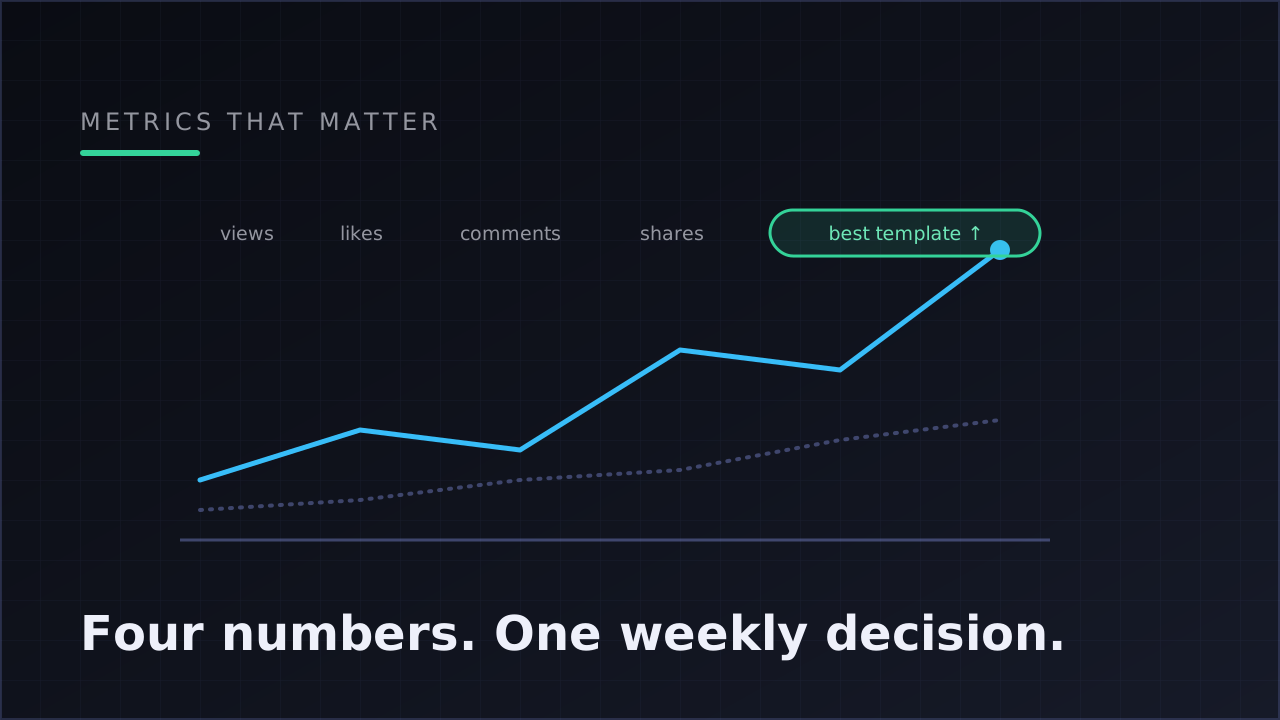
The social media metrics that matter for a content operator are the four every platform reports through its official API — views, likes, comments and shares — read at three levels: per post over time, posts compared against each other, and performance attributed to the content template that produced each post. The third level is where decisions come from.
Most analytics advice lists twenty metrics and produces zero decisions. This post goes the other way: four metrics, three levels of reading them, one weekly decision. It's scoped to what an operator running automated, multi-platform content can actually collect and act on.
Start with what's actually collectable
An honest analytics setup starts from a constraint most dashboards hide: platforms only expose certain numbers through their official APIs. Views, likes, comments and shares are the reliable, cross-platform core — collectable per post, on a schedule, from TikTok, YouTube and Instagram alike.
Platforms internally use richer signals — watch time, completion, rewatches — to decide what to recommend. You see fragments of those in each platform's own creator studio, but they're not consistently available to external tools, and any dashboard that implies it tracks them across platforms is decorating. Build your decisions on the four numbers you can trust, collected the same way everywhere, and treat platform-internal signals as context.
One collection detail that matters more than any extra metric: frequency and attachment. Numbers collected hourly, attached to the exact post that earned them, produce a curve — how a post accumulated views over its first 72 hours. Numbers eyeballed weekly across three creator studios produce vibes.
What each of the four metrics actually tells you
Views measure distribution: how many times the platform put your post in front of someone. Views are the platform's opinion of your content — the recommendation system sampled it, the early signals decided how far it spread. A view count is the output of the algorithm's judgment, which is why comparing views across your own posts (same account, same conditions) is meaningful while comparing them against other accounts mostly isn't.
Likes measure low-cost approval. The cheapest engagement to give, so the weakest single signal — but the like-to-view ratio is a decent proxy for "did the audience the algorithm found actually enjoy this?" A post with fat views and skinny likes found reach but not resonance.
Comments measure activation. Someone stopped scrolling, typed, and posted. Comment-heavy formats (questions, controversial takes, story cliffhangers) build the strongest algorithmic momentum on most platforms — and comments carry qualitative signal the other numbers can't: what viewers ask for next is free content research.
Shares measure endorsement. A share is a viewer spending their own social capital on your content — the strongest per-unit signal of the four, and the one most correlated with breakout reach. Formats that get shared (useful facts, relatable stories) compound in a way formats that merely get watched don't.
None of these is "the" metric. The reading comes from ratios and comparisons — which is the next level.
Three levels of reading, from data to decisions
Level 1: the per-post curve
A single post's numbers over time answer tactical questions. Did it get sampled and die (flat curve after hour six)? Slow-burn (steady accumulation for days — common on YouTube, rare on TikTok)? Spike-and-cliff (an algorithm test that failed the retention check)? The shape tells you more than the totals — two posts with identical final views and opposite curves are different lessons.
Level 2: posts against posts
Comparison is where analysis starts producing hypotheses. Put your last several posts side by side over the same window — say, five posts over 30 days — and the questions get sharper: does the story format consistently out-view the listicle format? Do Tuesday posts underperform? Does the same video behave differently on TikTok versus YouTube Shorts? (It usually does — audiences and algorithms differ, which is exactly why publishing one video to every platform is also a measurement strategy.)
Level 3: template attribution — the level that changes behavior
Here's the problem with post-level analytics: individual short-form results are noisy. Great formats throw duds; weak formats throw the occasional viral outlier. Judging your strategy on single posts is judging a poker player on one hand.
The fix is attribution one level up. When every post is generated from a template — a fixed recipe of format, voice, visuals and script style — performance aggregates per template. Twenty posts from the story template versus twenty from the facts template is a real experiment with real sample size. The question "which content recipe is winning?" gets a statistical answer instead of an anecdotal one.
This is the signal worth building your week around, and it's why Klipsy's dashboard leads with the best-performing template alongside lifetime totals, the 30-day per-platform trend and top posts: of everything the analytics collect, the template signal is the one that directly tells you what to make next. That handoff — measurement deciding production — is the whole thesis of the create → publish → measure loop.
The weekly reading, in practice
A sane analytics routine for a solo operator takes fifteen minutes:
- Check the template ranking. Which recipe won the week on aggregate views and engagement? Judge medians, not spikes — a template carried by one outlier is a lottery ticket, not a strategy.
- Scan per-platform trends. Is a platform drifting up or down for your niche over 30 days? Reallocate attention, not necessarily production — publishing everywhere is nearly free.
- Read five comments. The qualitative minute: what are viewers asking for? That's next month's template variation.
- Make one decision. Scale the winning template's cadence, revise the loser's script prompt or visual style, or kill it. One decision per week, executed by the automation, compounds; ten insights with no decision don't.
| Question | Metric to read | Level |
|---|---|---|
| Did this post work? | View curve + like ratio | Per-post |
| Is this format working? | Aggregate views/engagement per template | Template |
| Where is my audience? | 30-day trend per platform | Platform |
| What should I make next? | Best-performing template + comment themes | Template |
| Is the account growing? | Lifetime totals trending across months | Project |
Metrics traps that eat operators
Dashboard residency. Checking numbers daily feels like work and changes nothing — short-form data is too noisy at day granularity for strategy. Hourly collection, weekly reading.
Optimizing for likes. Likes are the most visible and least valuable of the four. Shares and comments predict compounding; a like-optimized format plateaus politely.
Judging templates on their best post. Survivorship bias in miniature. The template whose median post performs is the asset; outliers are weather.
Cross-account envy. Your views are a function of your niche, account age and format. Comparing against a different account's numbers imports noise. The only clean benchmark is your own posts under your own conditions — which, conveniently, is exactly what template attribution gives you.
Collecting without attributing. Numbers that don't trace back to the recipe that produced them can describe the past but can't steer production. If your workflow can't answer "which template made this post?", fix that before adding any metric — it's stage seven of the content automation workflow for a reason.
FAQ
Which social media metrics should I track?
The four reliably available per post from every platform's official API: views, likes, comments and shares. Read them as curves over time and aggregate them per content template. More exotic metrics add dashboard weight, not decisions — especially the ones platforms don't consistently expose to external tools.
What's a good engagement rate?
Treat published benchmarks skeptically — engagement varies wildly by niche, platform and format. The comparison that produces decisions is internal: this template's like/comment/share ratios against your other templates', on the same account under the same conditions.
How often should I check my analytics?
Collection should be automatic and frequent (hourly, per post). Reading should be weekly — short-form results are too noisy at daily granularity, and the decisions that matter (scale, revise, kill a template) are weekly decisions anyway.
Why do the same videos perform differently on different platforms?
Different audiences and different recommendation systems evaluate the same file independently. That divergence is signal: per-platform trends tell you where each format lands best, which is an argument for publishing everywhere natively and letting the numbers vote.
What's the single most useful number for an automated account?
Best-performing template. It aggregates away per-post noise, attributes results to a recipe you can actually reproduce, and answers the only question that changes next week's output: what should the automation make more of?