Comparing posts across TikTok, Instagram, YouTube and X without opening four apps
- compare social media posts
- cross-platform comparison
- multi-platform analytics
- social media performance comparison
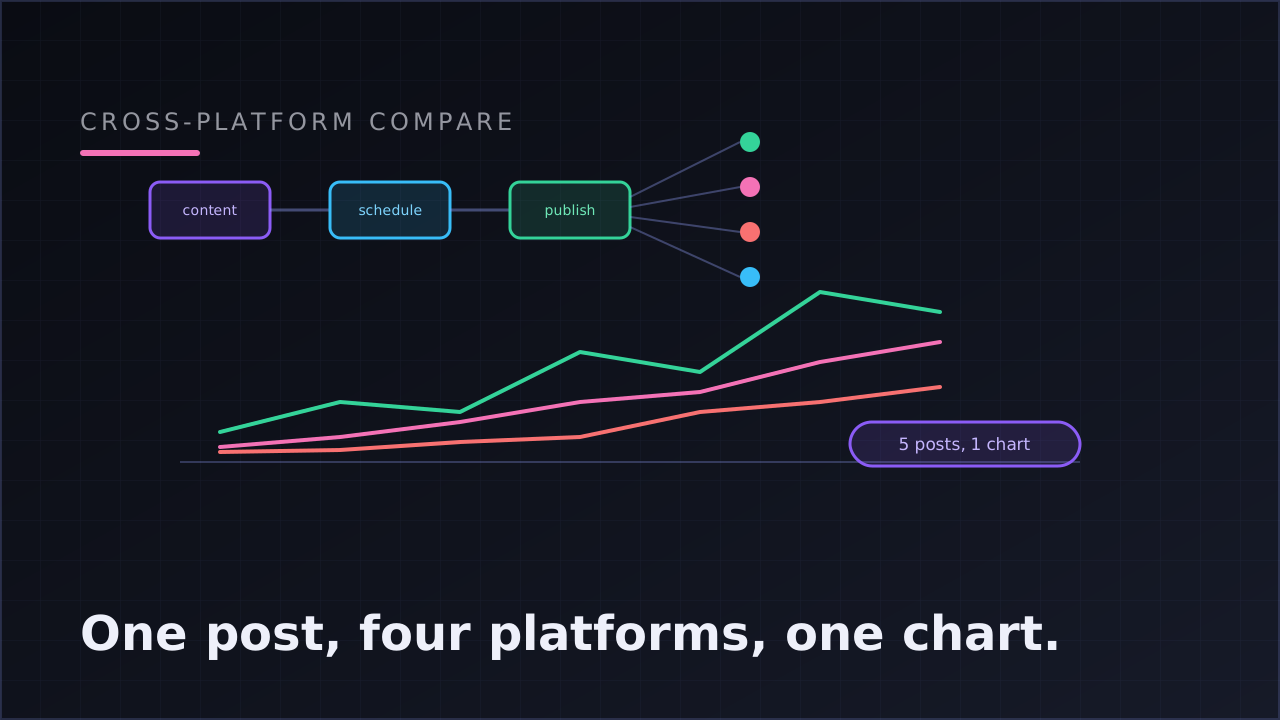
Post the same video to TikTok, Instagram and YouTube Shorts on the same day, and you'll get three different outcomes — different audiences, different recommendation systems, each one judging the same file independently. That divergence is useful information, but only if you can actually see it side by side. Four creator studios, four logins and four different chart styles make that comparison harder than it needs to be.
The comparison that a single-platform view can't show you
Every platform's own analytics does one job well: it tells you how your content on that platform performed relative to your other content on that platform. What it can't do is put a TikTok post and an Instagram Reel of the exact same video on the same chart, because it has no reason to know the other one exists.
That's the specific gap a cross-platform comparison closes. Not "how did this do on TikTok" — that's a solved problem — but "how did this do everywhere, plotted the same way, at the same time."
How to pick which posts to compare
A comparison is only as useful as what you put into it. A few patterns that produce real answers:
- The same content, multiple platforms. One video or image post published to all four connected platforms — the cleanest read on how platforms differ for identical content.
- Same template, different weeks. Five recent posts from one template, to sanity-check whether it's still performing consistently or drifting.
- Your suspected best against your suspected worst. Put a post you think worked next to one you think didn't, and confirm the gap is real rather than assumed.
Klipsy's post analytics view lets you select up to five posts — any mix of platforms, any mix of templates — and overlays their daily views, likes, comments and shares on one chart, so the comparison is visual rather than four browser tabs of mental math.
Reading an overlaid comparison
A multi-line comparison chart rewards a specific kind of reading — shape first, totals second:
| What you see | What it usually means |
|---|---|
| One line pulls away early and holds the lead | A genuinely stronger performer on that platform |
| Lines start close, then diverge after day 2-3 | Platform-specific algorithmic momentum kicking in differently |
| A line spikes late | Slow-burn distribution — common on YouTube, rarer on TikTok |
| Lines stay bunched the whole window | The content performed similarly regardless of platform — a useful negative result |
The last row matters more than it sounds — a comparison that shows no meaningful difference is still an answer. It tells you the platform isn't the variable worth optimizing for that piece of content, and the format or hook probably is.
From comparison to decision
A comparison chart is a diagnostic, not a strategy by itself. The step that makes it worth doing:
- Compare, then attribute. If one platform consistently wins for a given template, that's a scheduling decision — weight that template's cadence toward the platform where it performs, without abandoning the others entirely (native reach is close to free once the pipeline exists, a point covered in posting one video to every platform).
- Repeat with a fresh set periodically. A one-time comparison is a snapshot; audiences and algorithms shift. Rerun the comparison with recent posts every few weeks rather than treating one result as permanent.
- Feed it back into template selection. If a comparison keeps confirming that one template wins across platforms, that's evidence for the best-performing-template signal — the two comparisons (platform-vs-platform, template-vs-template) should agree more often than not.
FAQ
Can I compare the same post's performance across different platforms?
Yes — select any published posts (up to five, any platform mix) and Klipsy overlays their daily views, likes, comments and shares on one chart, so you can see how identical or similar content performed on each platform side by side.
Why does the same video perform differently on TikTok versus Instagram versus YouTube?
Each platform's recommendation system evaluates the same file independently, with a different audience and different ranking signals. That divergence is real signal, not noise — it tells you where a given format or template lands best.
How many posts can I compare at once?
Up to five. Beyond that, an overlaid chart stops being readable — if you need to compare more, aggregate by template instead of by individual post.
Is a cross-platform comparison a one-time check or something to repeat?
Repeat it periodically with recent posts. Audiences and algorithms change, so a comparison from months ago won't necessarily hold today — treat it as a recurring five-minute check, not a one-time verdict.
What should I do if a comparison shows no real difference between platforms?
Treat that as a useful result, not a failed comparison — it means the platform isn't the variable affecting performance for that content, and the format, hook or template is a more productive place to look next.